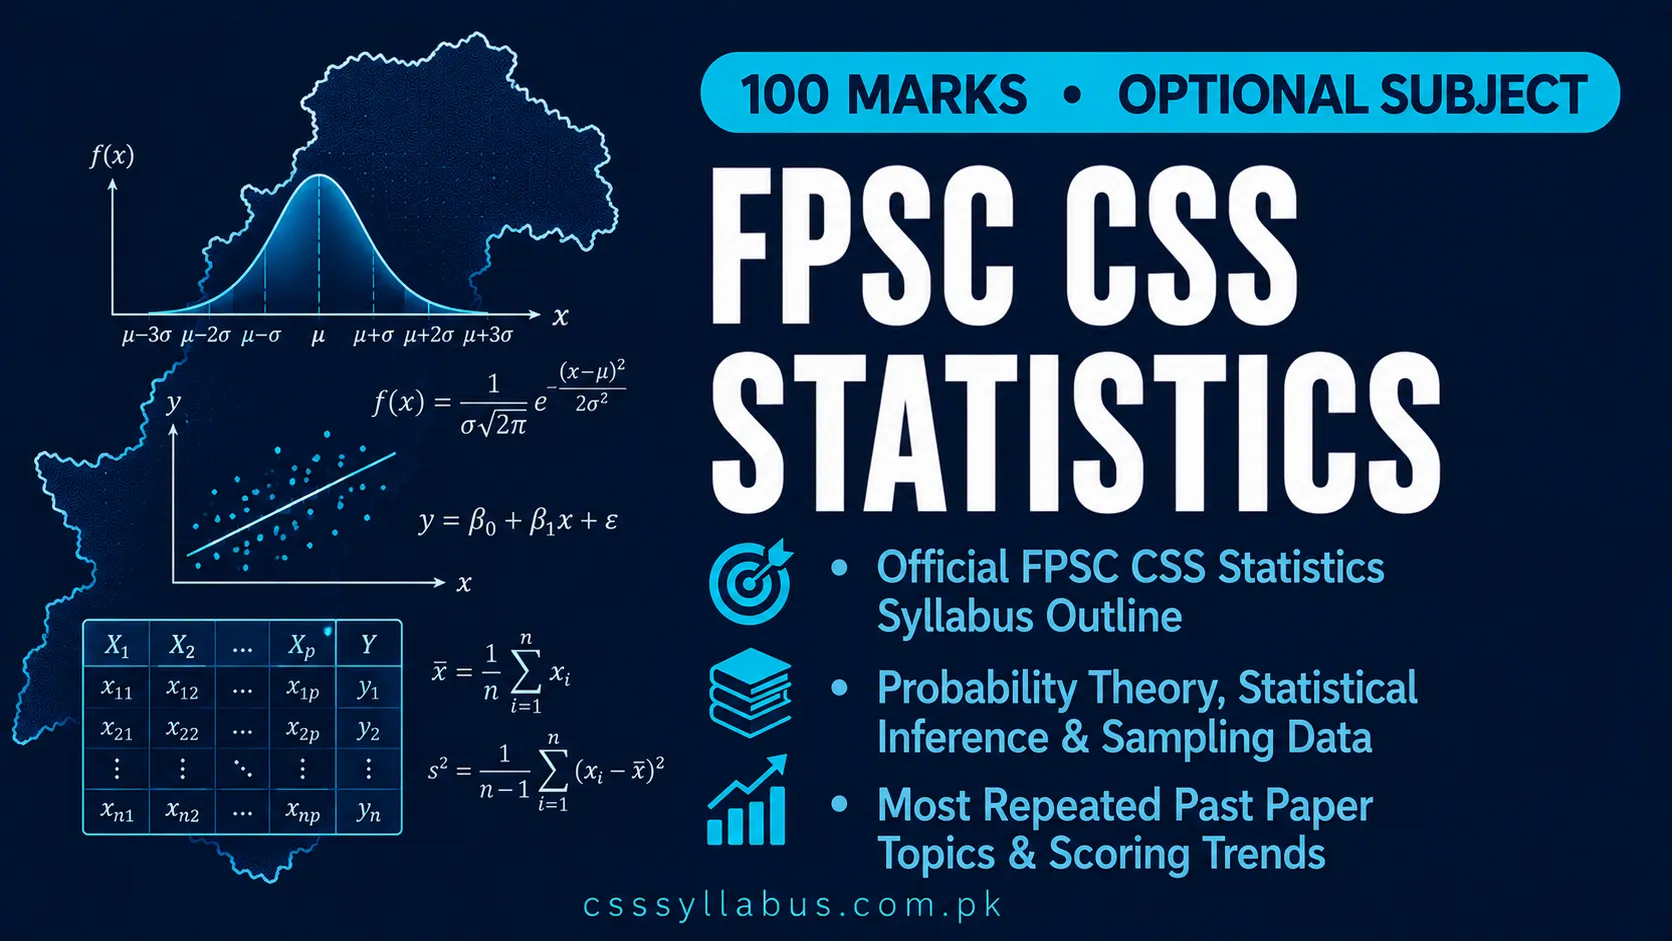
The CSS statistics syllabus carries 100 marks as a Group II optional subjects which includes Geology, Chemistry, Applied Mathematics, Pure Mathematics, and Physics. Statistics is a 100-mark paper — candidates combine it with Applied Mathematics or Pure Mathematics to reach the required 200-mark Group II total. The CSS statistics syllabus covers probability theory, statistical inference, regression analysis, sampling theory, hypothesis testing, and data analysis — drawing from standard undergraduate statistics curriculum. CSS Aspirants finalizing their optional subject combination can review the CSS optional subjects syllabus for group requirements and combination rules before confirming Statistics as a choice.
CSS STATISTICS Syllabus (100 MARKS)
Part – I (50 marks)
I. Descriptive Statistics Definition, Importance and scope of Statistics, Descriptive and Inferential Statistics, Presentation of the Data, Tables, Graphs and Charts: Stem-and leaf diagram, Box and Whisker Plots. Measures of Central Tendency/location, Measures of Dispersion/Variability: Measures of Skewness and Kurtosis.
II. Basic Probability Basic Probability Concepts, Additive and Multiplicative laws of Probability, Joint and Marginal Probabilities, Conditional Probability and Statistical Independence, Bayes’ rule. Concept of a Random Variable, Mathematical Expectations, Discrete and Continuous Random Variables, Probability Distribution, Mean and Variance of a Discrete Probability Distribution.
III. Probability Distributions Discrete and continuous Probability Distributions. Properties, applications of Binomial, Poisson, Hyper-geometric distribution, Normal Distribution and its properties, Standard Normal Curve, Normal approximation to Binomial and Poisson distribution.
IV. Regression Analysis & Correlation Analysis Concepts of Regression and Correlation and their application, Simple and Multiple Linear Regression (upto three variables), Estimation of the Parameters of simple regression Model, Method of least square, Inference regarding regression parameters. Correlation, Correlation Coefficient, Properties of Correlation Coefficient, Inference regarding correlation coefficient, Partial Correlation and Multiple Correlation Coefficients (upto three variables).
V. Non-Parametric Methods Parametric versus nonparametric tests, when to use non-parametric procedures, One-sample tests: Sign test, Wilcoxan signed ranks tests, Kolmogrov-Smirnov test, run test. Tests for two related samples: sign test, run tests, chi-square test, Test for two independent samples: Mann-Whitney test, Kolmogrov-Smirnov test.
Part – II (50 marks)
I. Sampling & Sampling Distributions Population and Sample, Advantages of Sampling, Sampling Design, Probability & Non-Probability Sampling techniques. Brief Concepts of Simple Random, Stratified, Systematic, Cluster, Multiphase and Multistage Sampling. Non-probability sampling: Purposive, Quota Sampling, Convenience & Accidental Sampling. Sampling with and without replacement, Application of Central Limit Theorem in Sampling, Sampling Distribution of Mean, difference between two Means, Proportion, difference between two Proportion and Variance.
II. Statistical Inferences Estimation: Point Estimation, Properties of a good Estimator. Interval Estimation. Interval Estimation of Single Population means and Single proportion. Difference between two means and Difference between two proportions. Hypothesis Testing: Types of errors. Hypothesis Testing for Population Mean. Inferences for difference between Two Population Means. Inferences for the difference between Means of Two Normal Populations using Independent Samples (variances are assumed Equal) for sample size. Inference for Two Populations Mean using Paired Samples. Hypothesis testing for Single Population Proportion and difference between two population proportions. Estimation of sample size Analysis of categorized data. Goodness of fit tests. Contingency tables. Test of independence in contingency tables.
III. Design of Experiments One-way and Two-way Analysis of Variance, Design of Experiments, Concepts of Treatment, Replication, Blocking, Experimental Units and Experimental Error, Basic Principles of Design of Experiments, Description, Layout and Statistical Analysis of Completely Randomized Design (CRD), Randomized Complete Block Design (RCBD), Multiple Comparison tests (LSD test).
IV. Population Analysis & Vital Statistics Population and Demographic Methods, Sources of Demographic data, Basic Demographic Measures, Sex Ratio, Child Women Ratio, Vital Index, Crude and Specific Birth and Death Rates, Total Fertility and Net Reproduction Rates. Official Statistics: Statistical Systems in Pakistan, Functions of Statistics Division, Bureaus of Statistics and NADRA. The National Income, Gross Domestic Product, Saving and Wealth, Index Numbers.
SUGGESTED READINGS
| Sr. No. | Title | Author |
|---|---|---|
| 1 | Principles and Procedures of Statistics | Steel, R and Torrie, J.H. |
| 2 | Probability and Statistics for Engineers and Scientist | Walpole, R.E., Myers, R.H. and Myers, S.L. |
| 3 | Introduction to Statistical Theory, Part-I & II | Chaudhry, S.M. and Kamal, S. |
| 4 | Introduction to Probability Theory and Statistical Inference, 3rd Edition. | Larson, H.J. |
| 5 | Design and Analysis of Experiments | Montgomery, D.C. |
| 6 | Fundamentals of Modern Statistical Methods | Wilcox, R. |
| 7 | Biostatistical Analysis | Zar, J.H. |
| 8 | Latest Statistical Methods | Vaidyanathan, M. |
| 9 | Statistical Methods | Aggarwal, Y.P. |
| 10 | Mathematical Statistics | Freund, John E. |
| 11 | Demographic Methods | Andrew Hinde |
| 12 | Publications of Federal Board of Statistics and Provincial Board of Statistics, Pakistan. | Govt. of Pakistan |
STATISTICS Frequency Analysis (2001–2025)
| Syllabus Topic | Number of Questions | Years Appeared | Percentage Weightage | Trend (High / Medium / Low) |
|---|---|---|---|---|
| Descriptive Statistics | 18 | 2001, 2004, 2009, 2010, 2011, 2013, 2014, 2015, 2016, 2017, 2018, 2019, 2020, 2022, 2023, 2023 (Special), 2025 | 11.25% | High |
| Basic Probability | 16 | 2001, 2002, 2003, 2004, 2005, 2009, 2010, 2011, 2012, 2013, 2014, 2015, 2017, 2018, 2019, 2020, 2022, 2023 | 10.00% | High |
| Probability Distributions | 22 | 2001, 2002, 2003, 2004, 2005, 2009, 2010, 2011, 2012, 2013, 2014, 2015, 2016, 2017, 2018, 2020, 2022, 2023, 2023 (Special), 2025 | 13.75% | High |
| Regression Analysis & Correlation Analysis | 24 | 2001, 2002, 2003, 2004, 2005, 2009, 2010, 2011, 2012, 2013, 2014, 2015, 2016, 2017, 2018, 2019, 2020, 2022, 2023, 2023 (Special), 2025 | 15.00% | High |
| Non-Parametric Methods | 6 | 2016, 2019, 2020, 2023, 2023 (Special) | 3.75% | Medium |
| Sampling & Sampling Distributions | 19 | 2001, 2002, 2004, 2005, 2010, 2011, 2012, 2013, 2015, 2016, 2017, 2018, 2019, 2020, 2022, 2023, 2023 (Special), 2025 | 11.88% | High |
| Statistical Inferences | 23 | 2001, 2002, 2003, 2004, 2005, 2009, 2010, 2011, 2012, 2013, 2014, 2015, 2016, 2017, 2018, 2019, 2020, 2022, 2023, 2023 (Special), 2025 | 14.37% | High |
| Design of Experiments | 20 | 2002, 2003, 2004, 2005, 2009, 2010, 2011, 2012, 2014, 2016, 2017, 2018, 2019, 2020, 2022, 2023, 2023 (Special), 2025 | 12.50% | High |
| Population Analysis & Vital Statistics | 12 | 2016, 2017, 2018, 2020, 2022, 2023, 2023 (Special) | 7.50% | High |
STATISTICS Top 5 Most Repeated Topics (2001–2025)
- Regression Analysis & Correlation Analysis (24 appearances)
- Statistical Inferences (23 appearances)
- Probability Distributions (22 appearances)
- Design of Experiments (20 appearances)
- Sampling & Sampling Distributions (19 appearances)